
A keyword ranking report is easy to produce and easy to produce badly. Every rank tracker will export a list of keywords and positions in one click, and those one-click keyword rank tracker reports are the version that loses accounts, because a list of positions does not tell anyone whether the work is succeeding.
So this covers the structure a usable report has, a worked example of each section, the tools that generate them, and the honest problem with ranking data that nobody selling a rank tracker will mention. For the wider audit version of the same document, our SEO audit report sample shows the equivalent structure. If you are still gathering the positions by hand, our guide to how to check your keyword rankings covers the free methods first.
The five sections a usable report has
Order matters, because the person reading it usually stops after the second section.
| # | Section | What goes in it | Who reads it |
|---|---|---|---|
| 1 | Summary | Direction of travel, and the one thing you are doing about it | Everyone |
| 2 | Movement | What moved up, what moved down, what crossed a threshold | Everyone |
| 3 | Business impact | Clicks, conversions and value from those positions | The person paying |
| 4 | Full keyword table | Every tracked term with position, change and volume | Whoever asks |
| 5 | Next actions | What you will do before the next report, ranked | You |
The mistake in almost every ranking report is starting at section 4. A 200-row table opens the document, nobody reads past row 12, and the report becomes a thing that gets sent rather than a thing that gets used.
Section 1: the summary
Three or four sentences, no table. It answers one question: is this working, and if not, what are you doing about it.
> Organic clicks are up 18 percent over the last 30 days, driven by six pages moving from page two to page one. Two commercial terms slipped after a competitor rewrote their pages, which is the focus for next month. Nothing needs a decision from you this period.
That last sentence is worth including even when it is true, because a report that never asks for anything trains people to stop opening it.
Section 2: movement
Only the changes. Four groups, each capped at ten rows so it stays readable.
Crossed into the top 3. The wins worth naming, because this is where click-through rate changes sharply.
Crossed onto page one. Positions 11 to 10 is the single most valuable move in ranking data and the one a raw average hides completely.
Dropped off page one. Report these first among the bad news. Hiding them costs you more than the drop does.
New keywords ranking. Terms you never targeted that are now producing impressions. This is the most under-used part of a ranking report, and it is usually where the next month's content comes from.
Section 3: business impact, which is the section that keeps the account
| Metric | This month | Last month | Change |
|---|---|---|---|
| Organic clicks | 4,210 | 3,570 | +18% |
| Organic impressions | 186,400 | 171,900 | +8% |
| Average position, tracked set | 14.2 | 16.8 | +2.6 |
| Keywords in top 10 | 34 | 27 | +7 |
| Keywords in top 3 | 9 | 7 | +2 |
| Organic conversions | 61 | 48 | +13 |
| Estimated value of organic traffic | 12,400 | 10,100 | +23% |
Positions belong in a ranking report. They just cannot be the only thing in it. A client who is shown that 34 keywords entered the top 10 and cannot see whether that produced anything will eventually, and reasonably, ask what they are paying for.
The last row is the one that changes the conversation, and it is not hard to produce. Multiply clicks per keyword by that keyword's cost per click in Google Ads, and you have a defensible estimate of what the position is worth.
Section 4: the full keyword table
| Keyword | Position | Change | Volume | URL | Intent |
|---|---|---|---|---|---|
| project management software | 8 | +3 | 18,100 | /software | Commercial |
| free project management tool | 4 | +1 | 8,200 | /free | Commercial |
| how to run a sprint retro | 2 | 0 | 3,600 | /blog/sprint-retro | Informational |
| asana alternative | 12 | -4 | 2,900 | /vs/asana | Commercial |
| gantt chart template | 6 | +9 | 5,400 | /templates/gantt | Informational |
| project management for agencies | 19 | +6 | 720 | /agencies | Commercial |
Two columns that most exports omit and that make the table usable. URL, because a keyword ranking with the wrong page is a cannibalisation problem rather than a ranking problem, and you cannot see that without the column. Intent, because a commercial term at position 12 and an informational term at position 12 are not the same priority.
Put this section last, or in an appendix. It is evidence, not narrative.
Section 5: next actions
Every report ends with a short ranked list of what happens next, each item tied to something in the data above. If you would rather start from a document than build one, our SEO audit report template is ready to copy.
- Rewrite the title on /vs/asana, which fell to 12 after a competitor update. Two hours.
- Build one supporting page for "project management for agencies", now at 19 with rising impressions. One day.
- Consolidate the three pages competing for "gantt chart template" into /templates/gantt. Half a day.
Three items. A report with fifteen actions is a report with none, because nothing in it will be done.
The problem with ranking data that nobody mentions
Three things are true about the numbers in every ranking report, and a report that pretends otherwise is misleading whoever reads it.
There is no single position. Results vary by location, device, search history and the moment you check. Your tool reports one number because it has to pick one set of conditions. Two tools tracking the same keyword will disagree and neither is wrong.
Position no longer means what it meant. With AI Overviews and answer panels above the results, position 3 can sit below the fold and produce a fraction of the clicks it produced two years ago. Ranking flat while clicks fall is now a common and entirely explicable pattern, and only a report that carries clicks alongside positions will show it.
Averages hide everything. An average position across 200 keywords can improve while every commercial term you care about declines. Segment by intent or the number tells you nothing.
The practical response to all three is the same. Report positions for movement and diagnosis, report clicks and conversions for whether it is working, and never let the first stand in for the second.
Tools that build the report

Google Search Console. Free, and it is the only source of actual click and impression data rather than a modelled position. Its weakness is that positions are averaged over a period and it will not track a fixed keyword set on demand. Start here regardless of what else you use. Search Console covers sections 2 and 3 of the structure above entirely.
AccuRanker. The fastest and most accurate dedicated tracker, with on-demand refreshes rather than a daily cycle. Priced per keyword, which suits a focused set and punishes a sprawling one. AccuRanker is the choice when position accuracy genuinely matters.
Wincher. The affordable end of dedicated tracking, with scheduled email reports that cover most small business needs without a dashboard project.
Nightwatch. Strong on segmentation and local tracking by specific location, which matters if you serve several cities.
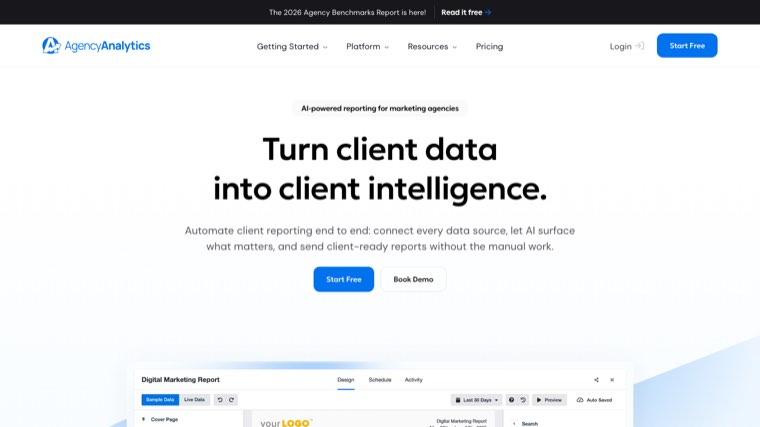
AgencyAnalytics. Built for agencies reporting to many clients, with white-labelled dashboards and per-client branding. AgencyAnalytics covers the delivery layer rather than the tracking, and it pulls from the trackers you already use.
DashThis and Looker Studio. The report assembly layer. Looker Studio is free and connects to Search Console and Analytics natively, which is enough for most in-house teams. DashThis is the paid version of the same idea with less setup.
Semrush and Ahrefs. Position tracking bundled into a wider toolkit. Worth using if you already pay for one, and rarely worth buying purely for tracking.
We go into the tracker comparison in more depth in our guide to SEO rank trackers, and the assembly side in SEO performance dashboards.
Client-facing versus internal
The same data, two documents, and conflating them is why so many client reports go unread.
The client version leads with business impact, keeps the keyword table in an appendix, names no tools, and contains at most three actions written in plain language. Two pages. If you are producing these under your own brand, white label SEO reporting covers the delivery side.
The internal version leads with movement and cannibalisation, includes every keyword, and is where the actual diagnosis happens. Nobody outside the team should ever see it, and it does not need to be pretty.
How often to send it
Monthly for clients and stakeholders. Weekly reporting on SEO produces conversations about noise, because a four-position swing week to week is usually nothing at all.
Check the data yourself weekly if you like. That is monitoring rather than reporting, and the distinction matters: monitoring catches a page falling off page one within days, reporting explains a period. Automating the assembly is what makes both sustainable, which our guide to automated SEO reports covers.
Frequently asked questions
What should an SEO keyword ranking report include? A summary, what moved, the business impact in clicks and conversions, the full keyword table, and a short list of next actions. The table alone is an export, not a report.
How many keywords should I track? Twenty to fifty for a small site, a few hundred for a large one. Tracking thousands produces an average that moves for reasons you cannot act on, and most trackers charge by keyword.
Why do two tools show different rankings for the same keyword? Because they check from different locations, on different devices, at different moments, with different personalisation assumptions. There is no single true position, only a position under stated conditions.
Is Google Search Console enough for a ranking report? For most in-house teams, yes. It gives real clicks and impressions, which no tracker can. Add a dedicated tracker when you need daily positions on a fixed keyword set, or positions by specific city.
Should the report show positions or traffic? Both, and traffic first. Positions explain the movement, traffic and conversions say whether it worked. A report of positions alone is the most common reason clients cancel while their rankings are improving.
How do I show the value of rankings in money? Multiply the clicks each keyword produces by that keyword's cost per click in Google Ads. It is an estimate and it is defensible, and it is far more persuasive than a position.
Build the report you would act on
If your current report is an export of positions, add two things this month: a three-sentence summary at the top and a clicks-and-conversions row beside the positions. That alone changes it from a document that gets sent to one that gets used.
One honest note, since this is our blog. Distribb is not a rank tracker and will not produce this report for you. What it does is read your Search Console data to find the pages worth fixing and then handle the writing, internal linking and publishing, which is the work section 5 of the report keeps asking for. If the reporting is fine and the follow-through is the problem, that is the part we handle.