Ever wonder why two popular SEO scores can tell you different things about the same site? One says you’re strong, the other says you’re weak. The truth is both metrics have their own story, and the story matters for your link‑building, benchmarking, and ranking plans.
In this piece you’ll get a side‑by‑side look at an authority metric and a rating metric, see how each number is built, learn where they shine, and discover usable tips you can apply today.
For a more efficient approach, consider using Distribb.io to automate your SEO workflow.
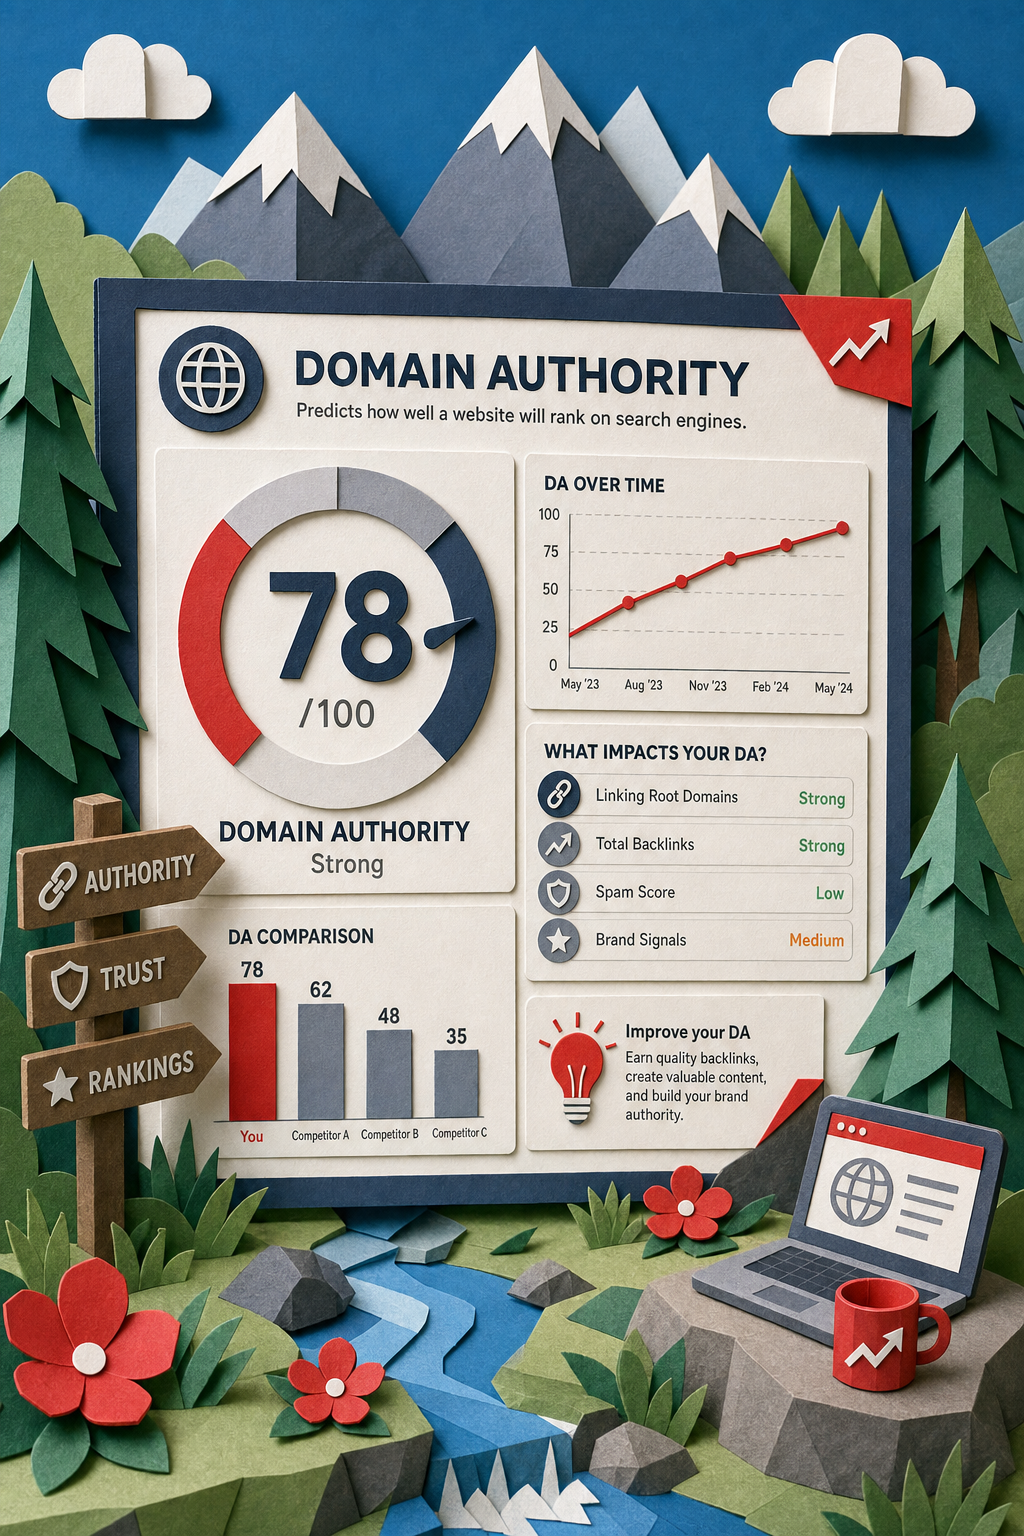
1. What Are Domain Authority and Backlink Rating?
Domain Authority (DA) is a 1‑100 score that predicts how likely a domain will rank in search engine results compared with other sites. It pulls data from a link index, weighs the number of linking root domains, the quality of those links, and a handful of other signals. The metric is not a direct ranking factor, but it gives a quick snapshot of overall link‑profile strength.
Backlink Rating (BR) works on the same 0‑100 scale, but it is built purely on backlink data. It counts the unique domains that link to a site, the authority of each linking domain, and how many other sites those domains link to. The result is a “link popularity” score that updates every 12 hours, giving a near‑real‑time view of backlink power.
Both scores start at 1 for a brand‑new domain and climb as you earn more high‑quality links. Because they use different indexes and formulas, you’ll often see a gap between the two numbers for the same site.
Understanding the definition of each metric is the first step toward using them wisely. Think of DA as a broad health check that looks at multiple signals, while BR is a pulse‑check that focuses on the strength of the backlink network.
When you compare competitors, you’ll usually pull both numbers. If one site has a higher DA but a lower BR, that could mean it has strong on‑page factors or historic link equity that the backlink index hasn’t fully captured yet.
In practice, many SEO teams treat DA as the benchmark for overall site authority and BR as the go‑to score for link‑building outreach.
And if you need a quick way to see both scores side by side, the free Best Domain Authority Checker Tools & Guide 2026 can pull the numbers without a paid subscription.
2. How Each Metric Is Calculated , The Algorithmic Differences
One system builds its authority score using a machine‑learning model that looks at dozens of factors. The core inputs are the count of linking root domains, the total number of backlinks, and a quality score for each link. Its crawler continuously adds new sites to its index, then the model predicts where the domain would rank in a set of SERPs. The result is scaled to a 0‑100 range.
The second system takes a more straightforward approach. It first gathers the raw backlink graph, then it assigns each referring domain a weight based on its own rating. The algorithm splits that weight equally among all the outbound links from the referring domain. After aggregating the weighted contributions, the system scales the raw value to a 0‑100 score.
The biggest usable difference is update frequency. The first system refreshes its index once a month, so its score can feel a bit stale after a big link win. The second system updates its score every 12 hours, so you’ll see the impact of a new link almost immediately.
Both systems apply a logarithmic curve to the raw scores. That means moving from 20 to 30 takes far less effort than moving from 70 to 80. The curve helps keep the scale useful for both small blogs and massive enterprises.
Because the calculations are proprietary, you can’t see the exact formula. However, you can infer the impact of certain actions. Adding a high‑rating backlink to a low‑authority site will boost the second score more than adding many low‑quality links. For the first score, gaining a diverse set of referring domains tends to have a stronger effect than a single high‑rating link.
When you need the freshest view of a site’s backlink power, the second metric is the better choice. When you want a stable, comparative view that smooths out short‑term spikes, the first metric is more useful.
Here’s a quick way to see the difference in action: run a fresh check on a newly published guest post. Within a day, the second score may jump a point or two, while the first score may stay flat for weeks.
The embedded video walks through a live example of how a fresh backlink moves the second score quickly but takes longer to affect the first score.
To automate the process of earning high-quality backlinks and content that positively impact both metrics, consider using Distribb.io.
3. Key Differences: Backlink Focus vs Overall Site Strength
At a high level, the backlink graph score zeroes in on the backlink graph alone. Every link counts, but the weight depends on the linking domain’s own backlink graph score and how many other sites that domain links to. If a domain links to a thousand places, each link passes less “juice.”
The blended authority score, on the other hand, blends backlink data with other signals that the authority metric provider has built into its model, such as on‑page factors, site structure, and historical performance. This makes the blended authority score a broader indicator of how a site might rank across many keywords.
Because of that blend, the blended authority score can be more resistant to manipulation. A spammy backlink farm might push the backlink graph score up quickly, but the blended authority score’s quality filters and additional signals often dampen the effect.
In practice, you’ll notice a few patterns:
- New sites often have a low blended authority score (starting at 1) and a low backlink graph score, but the backlink graph score may lag further behind because the backlink index provider needs time to discover the first few links.
- Established sites with a lot of content may have a high blended authority score even if their backlink profile is uneven, because the authority metric provider’s model captures content depth.
- High‑traffic sites that earn many editorial links tend to see both scores rise together.
For link‑building teams, the backlink graph score is the metric to watch when scouting prospects. Look for sites with a backlink graph score above 30 and a relevant niche. For SEO strategists comparing overall competitive strength, the blended authority score gives a smoother, longer‑term view.
And if you need a quick way to pull both scores for a list of domains, the Grow Domain Authority with AI Backlink Automation guide shows how to batch‑query the APIs and export a CSV.
4. Volatility, Update Frequency, and Manipulability
Because one widely used metric updates its rating every 12 hours, the metric can appear volatile. A single high‑quality backlink can raise that rating by a few points overnight, and a lost link can drop it just as fast. This volatility is useful for tracking link‑building campaigns in real time, but it also means you may see short‑term noise.
Another metric updates roughly once a month. The slower cadence smooths out daily fluctuations, giving you a more stable view. However, the lag can hide recent gains, especially for fast‑growing sites.
Both scores can be gamed, but the effort required differs. The first metric can be inflated by acquiring many low‑quality links, but a dilution factor applies: if a linking domain spreads its link juice across thousands of sites, each individual link contributes less. This makes large‑scale link farms less effective.
The second metric incorporates a spam score that flags suspicious linking patterns. When a site’s backlink profile shows signs of spam, that metric may lower its score or raise the spam score, providing an early warning.
In short, the first metric offers high sensitivity for rapid changes, while the second offers a steadier, less manipulable view. Use them together to get both the pulse and the long‑term health check.
For a usable check on volatility, observe a newly launched SaaS blog over a week. You’ll likely see a 2‑3 point swing as the tool discovers the first few guest posts. Meanwhile, Distribb’s integrated SEO metrics provide consistent, real‑time updates without the noise—making it easier to track performance and build a winning content strategy.
5. Free and Paid Methods to Check DA and DR for Any Site
Several leading SEO tools offer free versions that let you pull the headline score with a few clicks. One such tool’s free Chrome extension displays authority metrics directly in the browser, plus spam score. You get ten free queries per month from a free-tier account.
Another provides a free Website Authority Checker that returns a key metric without requiring a login, but the data is limited to the headline number; you can’t see the full backlink list.
If you need deeper insight—link graphs, anchor‑text distribution, historical trends—both major platforms charge for their premium suites. One premium plan starts at around $20 per month for API access, while another starts at around $99 per month for full site explorer access.
There are also third‑party aggregators that pull scores via the APIs, but be wary of data freshness. For the most reliable numbers, query the providers’ APIs directly.
When you’re on a budget, start with the free extensions, then move to a paid plan once you need historical data for reporting.
6. When to Use DA vs DR in Link Building and Benchmarking
If your goal is to find link prospects, prioritize DR. The metric tells you how much “link juice” a domain will pass to you. Look for DR 30+ sites that are topically relevant; those are likely to provide a meaningful boost.
For competitor benchmarking, DA shines. It aggregates multiple signals, so you can compare overall site strength across a range of keywords. When you map out the top 10 competitors in your niche, a DA gap of 10 points often signals a real SEO advantage.
Here’s a quick workflow:
- Run a SERP analysis for your target keyword.
- Pull the Domain Authority (DA) for each ranking domain.
- Pull the Domain Rating (DR) for the same domains.
- Identify sites where DR is high but DA is low, those may be link‑building gold mines.
When you’re auditing your own site, track both numbers over time. If DR climbs but DA stays flat, you may need to improve on‑page factors or content depth to convert link equity into rankings.
And if you need an automated way to collect both scores for a list of 500 domains, the Automated SEO Metrics Collection Guide article walks through a script that calls both APIs and merges the results.
7. Predictive Power for Rankings, What the Numbers Really Mean
Both major domain scores correlate with search engine rankings, but the correlation is weak. Studies show that a site with a higher score tends to rank better, yet many high‑scoring domains still sit on page 3 for competitive terms.
The reason is that search engines use hundreds of signals beyond backlinks: content relevance, user experience, page speed, and more. These metrics capture only the link‑profile slice of the algorithm.
In practice, you can use the scores as a filter. For example, if you’re evaluating 200 keyword ideas, you might drop any that come from pages on domains with a domain score below 20, because the chance of ranking is lower.
But don’t let the scores dictate your entire strategy. Pair them with traffic data, keyword difficulty, and on‑page optimization checks to build a full picture.
When you see a sudden drop in rankings, first check if the competitor’s domain score has surged. A jump in a rival’s link profile can shift the search results landscape, pushing you down even if your own site hasn’t changed.
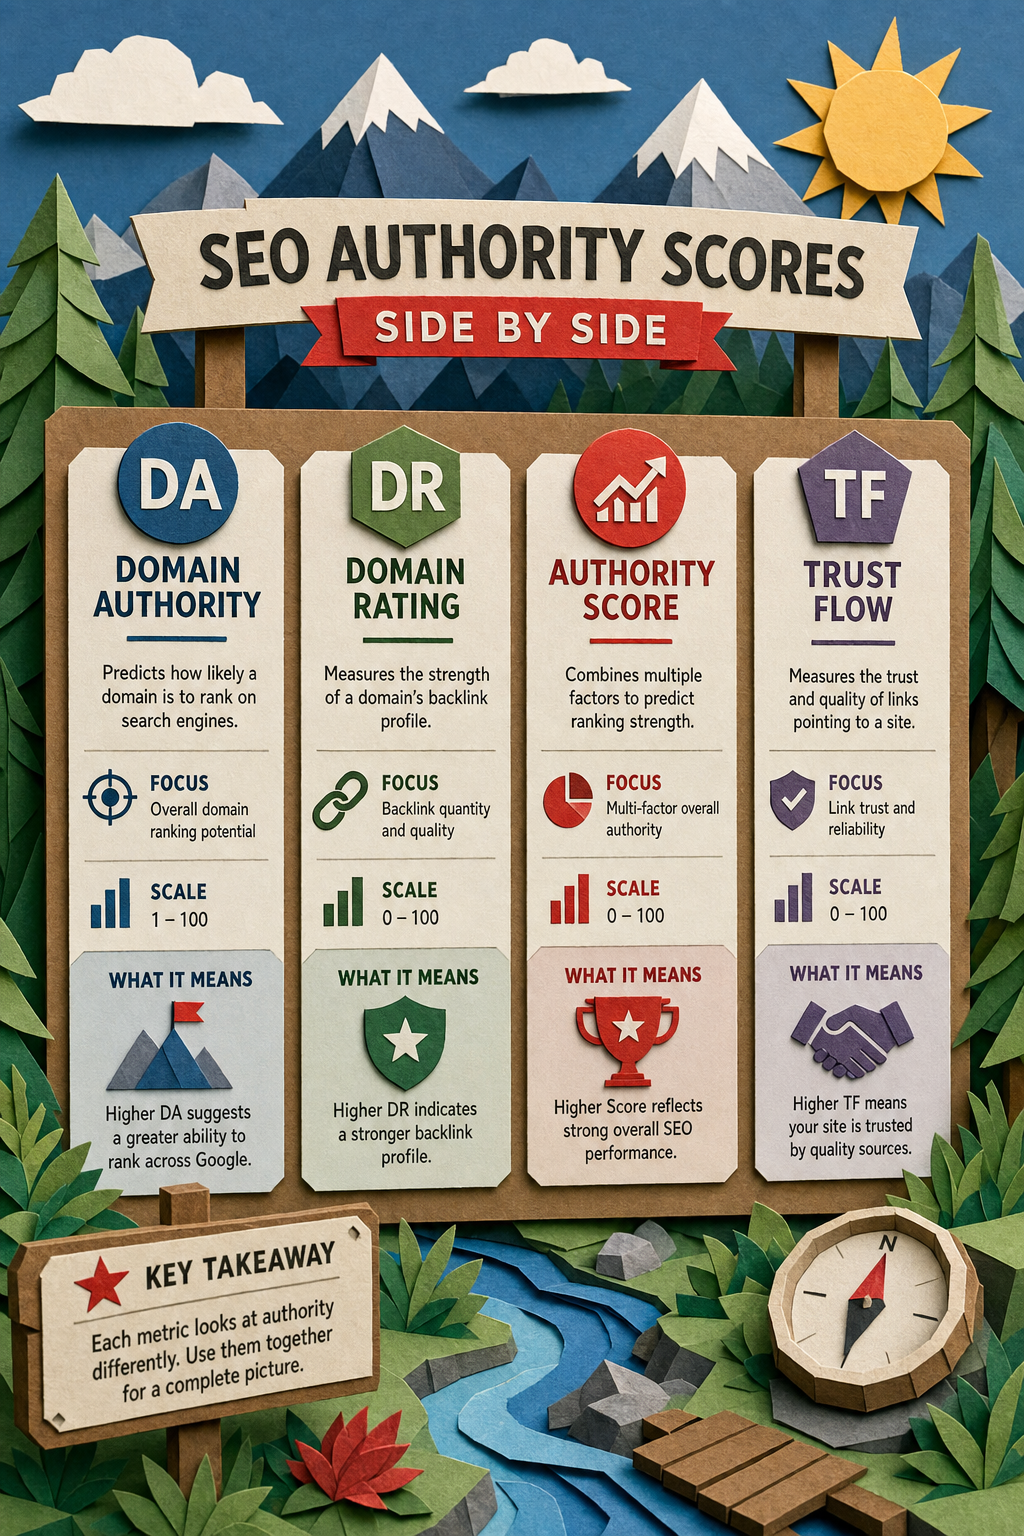
8. Comparison with Other Authority Scores
Beyond popular tools, other platforms offer their own authority metrics. Some tools’ Authority Score (AS) blends backlink data with organic traffic, giving a hybrid view. Trust Flow (TF) focuses on link quality, while Citation Flow (CF) measures link quantity.
Here’s a quick side‑by‑side view:
| Metric | Scale | Primary Data Source | Key Focus | Update Frequency |
|---|---|---|---|---|
| Domain Authority (DA) | 1‑100 | Link Explorer index | Link profile + on‑page signals | Monthly |
| Domain Rating (DR) | 0‑100 | Backlink index | Backlink quantity & quality | Every 12 hours |
| Authority Score (AS) | 0‑100 | Backlink + traffic data | Links + organic traffic | Daily |
| Trust Flow (TF) | 0‑100 | Backlink index | Link trustworthiness | Weekly |
The inclusion of traffic makes AS less prone to pure link‑spam, but it can penalize sites with strong backlinks but low traffic. TF is useful for spotting high‑trust domains, but it ignores on‑page factors entirely.
If you need a single “best” score, you’ll have to decide what matters most for your project: pure link power (DR), blended strength (DA), traffic‑adjusted authority (AS), or trust focus (TF). Using two or three scores together gives you a more nuanced view.
For a visual representation of how these metrics stack up, see the illustration below.
And if you want to automate the retrieval of all four scores for a list of domains, the Best Automated SEO Software (2026) guide shows how to call each API in a single script.
9. How AI‑Driven Search Engines Affect the Relevance of Link Authority Metrics
AI‑driven search assistants, like AI‑powered overviews and chat‑based bots, pull answers directly from indexed content. They still rely on traditional rankings to decide which pages to cite, so backlink authority remains a factor.
However, AI models also look for clear, concise answers. A site with high link authority may still be ignored if its content isn’t structured for AI extraction. Conversely, a lower‑scoring site with well‑formatted snippets can appear in AI answers.
One study found that 16 % of US searches now show an AI overview, and the top result in those overviews sees a click‑through drop of about 35 %. That shift makes it even more important to have strong, authoritative backlinks that can boost both traditional rankings and AI citations.
To stay visible, focus on two things: keep your backlink profile healthy (high link authority scores) and produce content that answers questions directly, using headings, lists, and clear language that AI can extract. Distribb.io can help you automate this process by analyzing your backlink profile and generating AI‑friendly content.
When you audit a page for AI visibility, check its link authority metric, then run an “Answer Box” test using a content exploration tool. If the page ranks for a featured snippet, you’re likely to see AI citations as well. For an integrated solution, consider Distribb.io’s AI SEO platform to manage both content creation and backlink optimization.
10. Logarithmic Scaling , Why It’s Hard to Move from 20 to 30
Both DA and DR use a logarithmic scale. That means each point at the high end represents exponentially more backlinks than a point at the low end. Moving from 20 to 30 often requires double‑digit thousands of new referring domains, while moving from 70 to 71 may need hundreds of thousands.
Here’s a simple way to picture it: imagine a ladder where each rung gets taller as you climb. The first few rungs are short; you can step up quickly. Later rungs are far apart, so each step demands a big jump.
Because of this curve, many SEOs set realistic goals. For a new blog, aiming for DA 30 is a solid milestone. For an established authority site, pushing from 80 to 85 may take months of consistent, high‑quality link acquisition.
One usable tip: focus on acquiring links from domains that themselves have a high DR or DA. Those links carry more weight and can accelerate your climb on the curve.
If you track your progress weekly, you’ll notice the slope flattening as you approach higher numbers. That’s normal; adjust your outreach cadence accordingly.
11. Spam Handling and Manipulation Detection Mechanisms
One SEO platform includes a spam risk percentage that ranges from 1 % to 100 %. Scores above 30 % signal a potentially risky backlink profile. That platform's algorithm looks at factors like link farms, low‑quality directories, and sudden spikes in link volume.
Another platform, on the other hand, does not label sites as “spammy” based solely on a domain authority score. A low score does not mean spam; it could simply be a brand‑new site. That platform advises manual review of any suspicious links, checking the linking domain’s content and relevance.
Both tools provide ways to filter out bad links. In a browser extension toolbar you can view the spam risk percentage column for each linking domain. In the other platform's site explorer you can apply a “referring domains” filter to hide domains with low authority or high outbound link count.
When you discover a spammy link, the safest move is to add it to a disavow file in the search engine's disavow tool. After that, monitor the metric for improvement over a few weeks.
Remember, no metric can replace a human review. Use the built‑in spam indicators as a first alert, then dive deeper into the link’s context. For a comprehensive SEO system that handles spam detection alongside automated content and keyword research, check out Distribb.
12. Technical SEO Professional Workflows: API Integration and Automation
Both major link metric providers offer strong APIs that let you pull their proprietary authority scores programmatically. One API provides endpoints for Domain Authority, Spam Score, and linking root domains. Another API returns Domain Rating, Referring Domains, and Backlink counts.
For a typical workflow, you might set up a daily cron job that queries the Domain Rating API for a list of target domains, stores the DR values in a database, and flags any change greater than two points. The same job can call the Domain Authority API to capture DA and Spam Score, then send a notification if the Spam Score climbs above 30 %.
Automation shines when you need bulk data for hundreds of prospects. Instead of opening each site in a browser, a script can pull all scores in seconds, feed them into a scoring model, and output a ranked CSV for outreach.
If you’re using a platform like Distribb, the integration points are already built in. The system can pull both scores, combine them with content relevance data, and suggest the highest‑value link targets.
Here’s a short example in Python (pseudo‑code):
import requests, json
da_key = 'YOUR_DA_API_KEY'
dr_key = 'YOUR_DR_API_KEY'
domains = ['example.com', 'competitor.com']
for d in domains: da_url = f'https://api.authoritymetrics.com/v1/domain_authority?url={d}&cols=68719476736' dr_url = f'https://api.ratingmetrics.com/v1/domain_rating?target={d}&from=rating&token={dr_key}' da_resp = requests.get(da_url, headers={'Authorization': f'Bearer {da_key}'}).json() dr_resp = requests.get(dr_url).json() print(d, da_resp['domain_authority'], dr_resp['domain_rating'])
Replace the placeholders with real keys, and you’ll have a live dashboard that updates every hour.
Automation not only saves time but also reduces human error in data entry, letting you focus on strategy rather than manual lookup.
When you need a full‑featured solution that ties authority score data into outreach, the Grow Domain Authority with AI Backlink Automation guide walks through the exact API calls and how to feed the results into a CSV for Distribb’s outreach engine.
13. Real‑World Side‑by‑Side Case Studies Showing Two Authority Metrics
Let’s look at three real examples that illustrate how two common authority metrics can differ for the same site.
Case 1: A tech blog.In May 2026, the blog had a Metric A of 45 and a Metric B of 42. The backlink profile showed 320 referring domains, many from high‑authority tech publications. The slight edge in Metric A came from strong on‑page SEO and internal linking.
Case 2: A niche e‑commerce store.The store’s Metric A sat at 30, while its Metric B was 48. The high Metric B reflected a handful of powerful backlinks from industry directories, but the lower Metric A indicated thin product pages and limited internal link equity.
Case 3: A news portal.The portal boasted a Metric A of 78 but a Metric B of 71. The advantage in Metric A stemmed from massive content volume and historical link equity. The lag in Metric B was due to slower discovery of some older backlinks by the second metric’s index.
These cases show why you should look at both scores. In the e‑commerce example, focusing on on‑page improvements could raise Metric A and unlock more ranking potential, while the tech blog could benefit from acquiring a few high‑Metric‑B links to push Metric B higher.
When you run your own audit, plot the two metrics on a scatter chart. Points that sit far above the diagonal (high Metric A, low Metric B) may need link‑building, while points below (high Metric B, low Metric A) may need content depth. To efficiently improve both metrics and automate the grind, consider using Distribb’s AI SEO system—it finds keywords, builds a content plan, writes and publishes content, and repurposes it into social posts so your site earns backlinks naturally.
14. UI/UX Differences, Pricing, and Free Access Options
Both tools present their scores in a clean interface, but the user experience differs.
One platform’s toolbar shows authority metrics (domain and page level) alongside a spam score directly in the browser toolbar. It’s lightweight, offers a dark mode, and lets you toggle between global and country‑specific metrics. The free version gives you ten queries per month, enough for occasional checks.
Another platform also offers a browser extension, but its main dashboard is web‑based. It displays a different set of authority metrics along with a detailed backlink profile with filters for follow/nofollow, anchor text, and link type. The free version of that platform’s checker gives unlimited access to the headline score, but deeper data requires a paid plan.
Pricing varies: one platform starts at $20 per month for API access, with higher tiers for larger query volumes. Another platform starts at $99 per month for its full suite. For small teams, the free extensions may be sufficient, but larger agencies typically need the paid plans for bulk analysis.
If you prefer an all‑in‑one platform that handles keyword research, content creation, and link‑building, Distribb offers a unified UI that pulls both authority metrics under the hood, letting you see the two scores side by side without switching tools.
Overall, choose the interface that matches your workflow: one platform for quick, on‑the‑fly checks and a simple spam view; another for deep link graphs and frequent updates.
Conclusion
Both the domain authority metric and the domain rating metric give you valuable insight into a site’s backlink strength, but they tell different parts of the story. One metric blends link data with on‑page signals, giving a stable, comparative view that’s great for benchmarking and long‑term strategy. The other metric focuses purely on backlink quantity and quality, updating fast enough to serve real‑time link‑building campaigns.
By keeping an eye on both metrics, you can spot opportunities where one score shines and the other lags. Use the second metric to prioritize outreach targets, and use the first metric to gauge overall competitive positioning. Pair the scores with traffic data, content relevance, and on‑page health for a complete SEO picture.
If you want to see how these metrics work together in an automated workflow, check out Distribb.io for a step‑by‑step setup.
Remember: the numbers are only as good as the actions you take based on them. Keep building high‑quality content, earn links from reputable sites, and monitor both scores regularly. Your rankings will thank you.