Most marketers chase leads but end up paying too much. Knowing your average cost per lead can stop that waste. In this guide you’ll learn how to compute the metric, what moves the number up or down, and what a good number looks like for 2026. Let’s get into it.
What Is Average Cost per Lead?
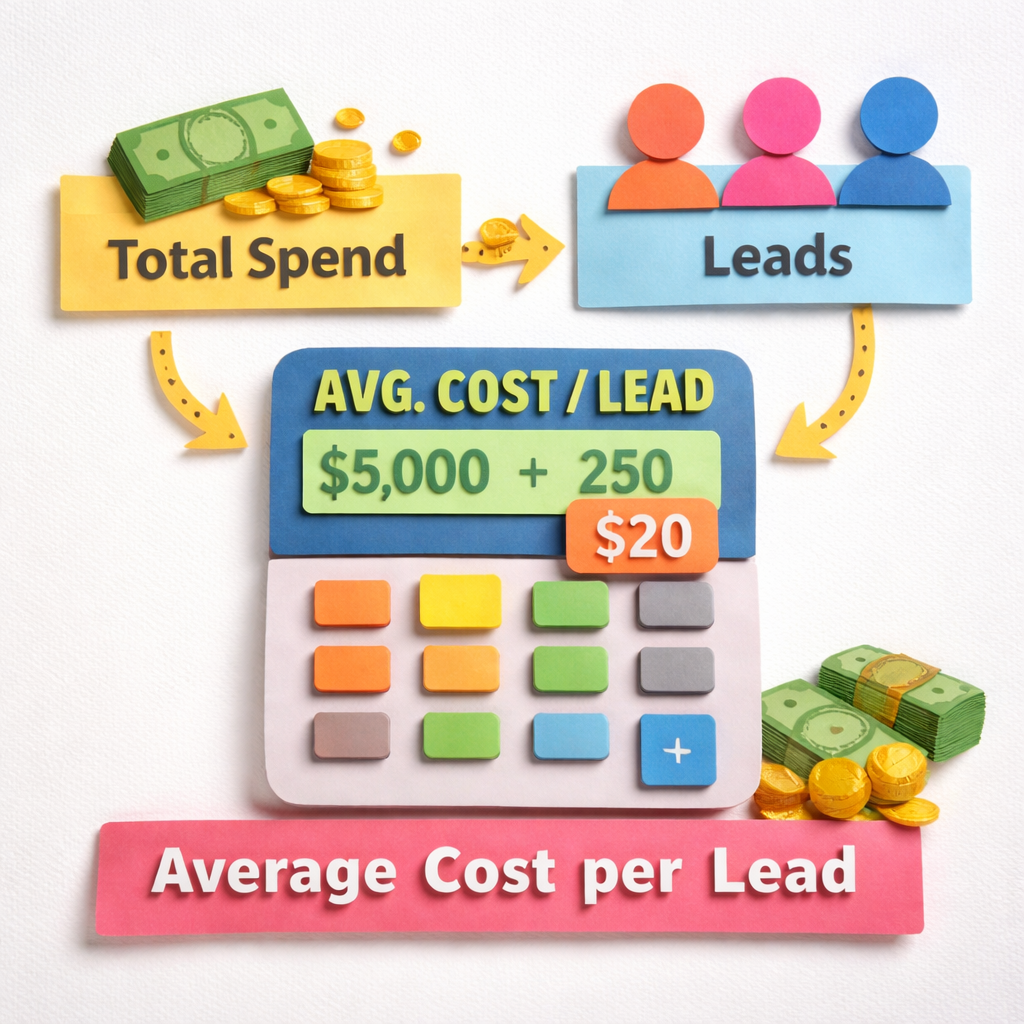
The average cost per lead tells you how much you spend to get one interested person. A lead is someone who fills a form, signs up for a newsletter, or asks for a demo. When you divide the total spend by the number of leads you get a single dollar amount.
This metric matters because it shows how well your budget works. If the number is high, you may be wasting money. If it is low, you are likely getting value. It also helps you compare different campaigns and channels.
For example, a business that spends $2,000 and gets 100 leads has an average cost per lead of $20. That figure can be compared to other months, other channels, or industry norms.
One source explains that the metric is a core part of digital marketing decisions. It says that tracking the right numbers lets you see where to improve fast. Read more about why CPL matters in a KPI guide.
Another source points out that CPL differs from cost per action. Cost per action looks at the cost of a sale or a download, while CPL stays at the top of the funnel. Learn how CPL fits with other metrics on a finance education site.
Knowing this difference helps you set realistic goals. You might aim for a low CPL to fill the pipeline, then focus on cost per acquisition later. The key is to keep an eye on both numbers.
In practice, you will track CPL for each campaign, each channel, and each month. That way you spot trends early. If a channel’s CPL spikes, you can pause it before money drains.
Overall, average cost per lead is a simple yet powerful number. It tells you if your spend is paying off and guides you toward smarter budgeting.
How to Calculate Your Average Cost per Lead
Calculating the average cost per lead is easy if you follow three steps. First, gather every cost that goes into a campaign. Second, count every lead the campaign produces. Third, divide the spend by the lead count.
Step one means you add up ad spend, creative production, tool fees, and any staff time you paid for the campaign. Even the cost of a freelance writer belongs here because it adds to the total.
Step two means you count only qualified leads. A qualified lead has taken a clear action, like filling a contact form. Do not count page views or likes; they are not leads.
Step three is the math: total spend ÷ total leads = average cost per lead. If you spent $5,800 and got 200 leads, the calculation is $5,800 ÷ 200 = $29 per lead.
Below is a simple template you can copy into a spreadsheet. It keeps the numbers clear and lets you update it each month.
Spreadsheet Template
- Column A: Campaign name
- Column B: Total spend (include all costs)
- Column C: Leads generated
- Column D: Formula =B/C (average cost per lead)
Once you have the template, you can break the data down by channel, by month, or by product line. That gives you a deeper view of where the money works best.
Here is a quick visual you can use to show the formula in a report.
Make sure you update the numbers weekly if you run fast‑moving campaigns. Frequent updates keep the metric fresh and let you act quickly.
One research report from FirstPageSage shows that industry averages vary a lot. Knowing your own number helps you see if you are above or below the norm. Check the 2026 industry CPL report for benchmarks.
Another tip is to run a small test campaign with a known budget. Use the same steps to get a test average cost per lead. Then compare that test number to your larger campaigns. See how test data can guide budgeting in the same source.
When you keep the process simple, the average cost per lead becomes a habit, not a chore.
Factors That Influence Cost per Lead
Many things push the average cost per lead up or down. Knowing the levers helps you control the number.
Audience targeting is a big factor. If you aim at a wide audience, many clicks will be from people who are not ready to buy. That raises the cost. Narrowing the target to people who match your ideal customer profile usually drops the number.
Ad creative matters too. A boring headline or a blurry image leads to low clicks. Better copy and clear images raise click‑through rates, which lowers the average cost per lead.
Landing page design also plays a role. If the page loads slow or looks confusing, visitors leave without filling the form. A fast, clean page with a strong call to action improves conversion and cuts cost.
Channel choice is another lever. Paid search often costs more per lead than organic SEO, but it can bring leads faster. Organic methods need time but can be cheaper in the long run.
Seasonality can shift numbers as well. Certain months see higher competition for ad space, which pushes up costs. Planning ahead for peak periods can keep the average cost per lead stable.One article notes that 68% of marketers say social media gives them the most leads. It also says that poor targeting on social can spike costs. Read more about social media lead factors on a lead‑generation blog.
Another source explains that tools, salaries, and agency fees all add to the spend side of the equation. Understanding each cost line helps you trim waste. Explore a full cost breakdown on an expansion marketing site.
Finally, testing and optimization keep the number in check. Running A/B tests on headlines, images, and forms reveals what works best. The data from those tests lets you drop the high‑cost elements.
By looking at each factor, you can create a checklist to audit any campaign. The checklist includes audience definition, creative quality, landing page speed, channel mix, and seasonality.
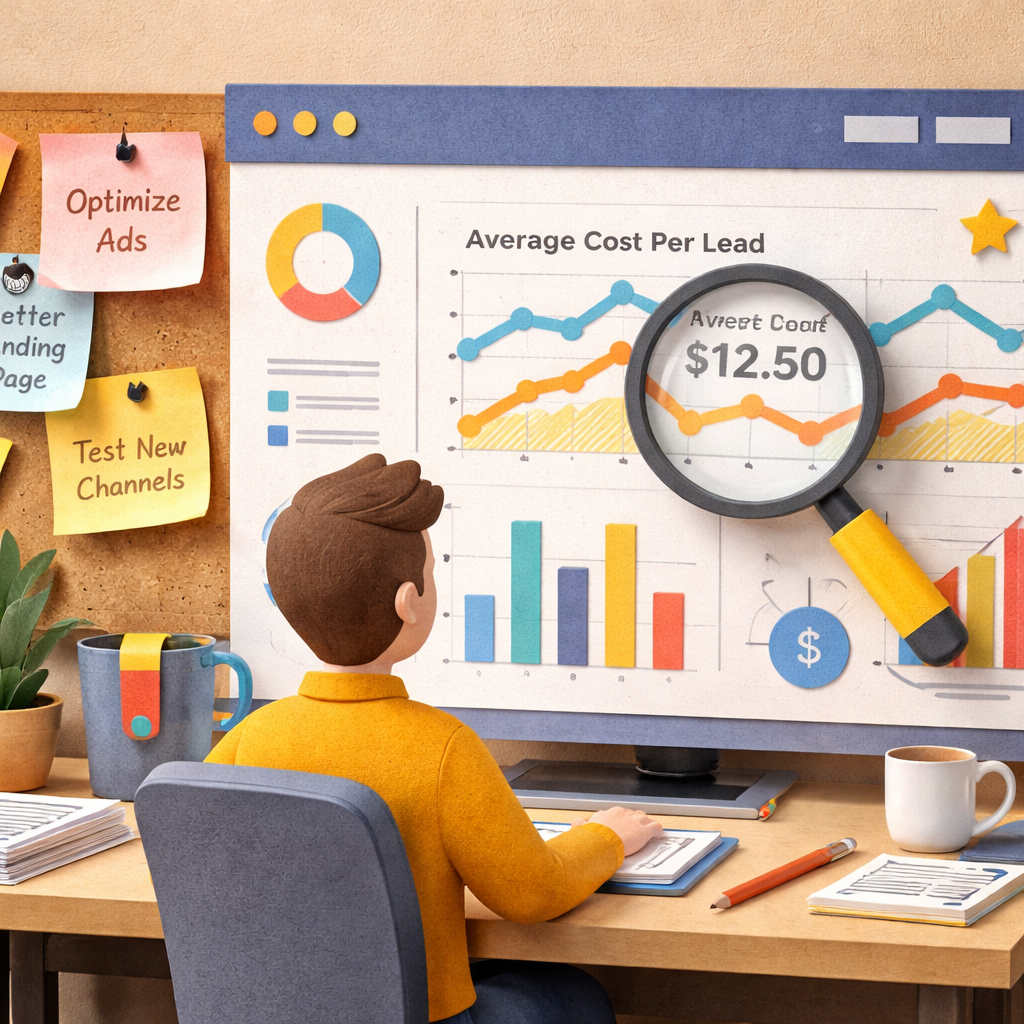
Video: Quick Walkthrough of a Lead Cost Calculator
Seeing a calculator in action makes the math feel real. Below is a short video that walks through a popular CPL tool.
The video shows how to enter spend, how to add indirect costs, and how the tool breaks down the result by channel.
After the video, try the steps on your own spreadsheet. Start with a single campaign, then expand to all channels.
The same source that hosts the video also gives tips on using the calculator for budgeting. It stresses that you should track both direct spend and hidden costs like staff time.
Another tip from the source is to run scenario analysis. Change the spend number up or down and watch how the average cost per lead shifts. That helps you plan for different budget levels.
Remember to keep the data clean. Double‑check that every lead counted really matches your definition. Bad data will give a wrong average cost per lead.
When you use the calculator regularly, you’ll spot trends early and can act before the budget leaks.
Cost per Lead Comparison Table by Channel
Below is a table that compares average cost per lead across common channels. The numbers come from recent industry research.
| Channel | Average CPL (USD) | Pros | Cons |
|---|---|---|---|
| Paid LinkedIn Ads | $408 | Targets decision makers | Higher spend |
| Facebook Ads | $142 | Large audience | Lower intent |
| PPC (Google) | $463 | Immediate traffic | Cost can rise fast |
| SEO (organic) | $206 | Steady long‑term flow | Slow start |
| Direct Mail | $250 | Physical touch | Higher per‑piece cost |
| Affiliate Marketing | $73 | Pay for performance | Partner quality varies |
| Referral Programs | $25 | Low cost, high trust | Depends on existing customers |
The table shows that cheap channels are not always the best. A $25 referral may bring a lead, but the volume can be low. A $408 LinkedIn lead costs more but often comes from a buyer who can close quickly.
One source notes that trade shows can cost up to $840 per lead, making them the most expensive channel. It also says that multi‑channel prospecting can average $188 per lead, which is a balanced approach. Read the full channel benchmark report for more detail.
Another source points out that social media can vary a lot. In real‑estate, the average cost per lead on social sits around $416 to $480. See the social media CPL range on a marketing blog.
Use the table as a starting point, then plug your own numbers in. That will tell you which channels are worth more budget.
Benchmarking Your Cost per Lead: What’s a Good Number?
Knowing if your average cost per lead is good needs a benchmark. Benchmarks differ by industry, by channel, and by the value of a customer.
In e‑commerce the average cost per lead in 2026 sits at $27.25. That is low because the goal is often a quick purchase, not a long sales cycle.
For SaaS businesses, the average cost per lead is $63.40, but qualified leads can cost $150 to $250. The higher price reflects the higher lifetime value of a SaaS customer.
Legal services see an average cost per lead of $650, with some leads costing up to $784. Those numbers are high because a legal client can bring a large contract.
One research site breaks down the numbers by sector and shows that finance can reach $58.70 on average, while home services average $34.00. Explore the 2026 industry CPL benchmarks on an ad tech blog.
Another source adds that B2B lead costs can range from $420 to $3,080. The wide range comes from different deal sizes and buying cycles. Read the B2B CPL range analysis on a revenue‑growth site.
To decide what a good number is for you, compare three things: your industry average, your customer lifetime value, and your current conversion rate. If your average cost per lead is lower than the industry average and still brings in customers who pay back the cost within a few months, you are in good shape.
Here is a quick checklist to evaluate your number:
- Is your CPL below the industry average?
- Does the CPL fit within your overall CAC goal?
- Do leads convert at a rate that gives a positive ROI?
- Can you lower the CPL by tweaking targeting or creative?
If you answer yes to most of those points, your average cost per lead is healthy. If not, treat the metric as a signal to test new ads, new audiences, or new landing pages.
Remember that a higher cost can still be okay if the lead quality is high. A $200 lead that closes a $10,000 contract is worth more than a $50 lead that never buys.
Keep tracking the metric month over month. Spotting a steady rise alerts you before the budget leaks.
FAQ
How often should I recalculate my average cost per lead?
Recalculate at least once a month if you run multiple campaigns. For fast‑moving paid ads, a weekly check helps you catch spikes early. When you launch a new channel, do a fresh calculation after the first 30 days. Regular updates keep the number fresh and let you act quickly.
What costs count toward the average cost per lead?
Include every dollar you spend to get the lead. That means ad spend, creative production, tool fees, agency costs, and staff time. Even the cost of a freelancer who writes copy belongs in the total. The more complete the list, the more accurate your number will be.
Can I use average cost per lead to predict revenue?
Only as a piece of a larger picture. If you know your conversion rate from lead to sale and the average deal size, you can multiply those by the number of leads you expect. That gives a rough revenue forecast. But remember that lead quality can shift the conversion rate.
How does average cost per lead differ from cost per acquisition?
Average cost per lead measures the spend to get a name or contact. Cost per acquisition looks at the spend to close a sale. CPL sits at the top of the funnel, CPA at the bottom. Both are useful, but they answer different questions.
What is a realistic average cost per lead for a small B2B startup?
For many B2B startups, a range of $50 to $150 is common. It depends on the niche and how targeted the ads are. If you use LinkedIn, expect numbers toward the higher end. If you lean on SEO, you may see lower costs after the initial ramp‑up.
How can I lower my average cost per lead without hurting quality?
Start by tightening audience targeting. Test new ad copy that speaks directly to pain points. Improve landing page speed and clarity. Run A/B tests on forms to reduce friction. Also, retarget visitors who showed interest but didn’t convert; they often cost less to bring back.
Should I factor in the cost of lead nurturing into average cost per lead?
Generally, you keep nurturing costs separate. CPL focuses on acquisition. Once the lead is in your system, you track nurturing spend under marketing automation or sales enablement budgets. Keeping them separate helps you see where each dollar works best.
Is there a difference in average cost per lead between paid and organic channels?
Yes. Paid channels usually have a higher average cost per lead because you pay for each click or impression. Organic channels like SEO often have lower CPL after the initial investment, but they need time to build traffic. Both can complement each other in a balanced strategy.
Conclusion
Average cost per lead is a simple number that tells you how efficiently you turn money into potential customers. By calculating it correctly, watching the factors that move it, and comparing it to industry benchmarks, you can make smarter budget choices. Use the steps, the checklist, and the tables in this guide to keep the metric in check. When the number stays healthy, your marketing spend works harder and your pipeline fills faster. Ready to tighten your spend? Start tracking your average cost per lead today and watch your ROI improve.